Results and viewer
After the analysis completes, open the 3D Viewer to verify the analyzed geometry and interact with results.
3D Viewer Overview
The viewer displays the exact geometry sent to the server for analysis. Verify here that all relevant windows, obstructions, and rooms were correctly extracted.
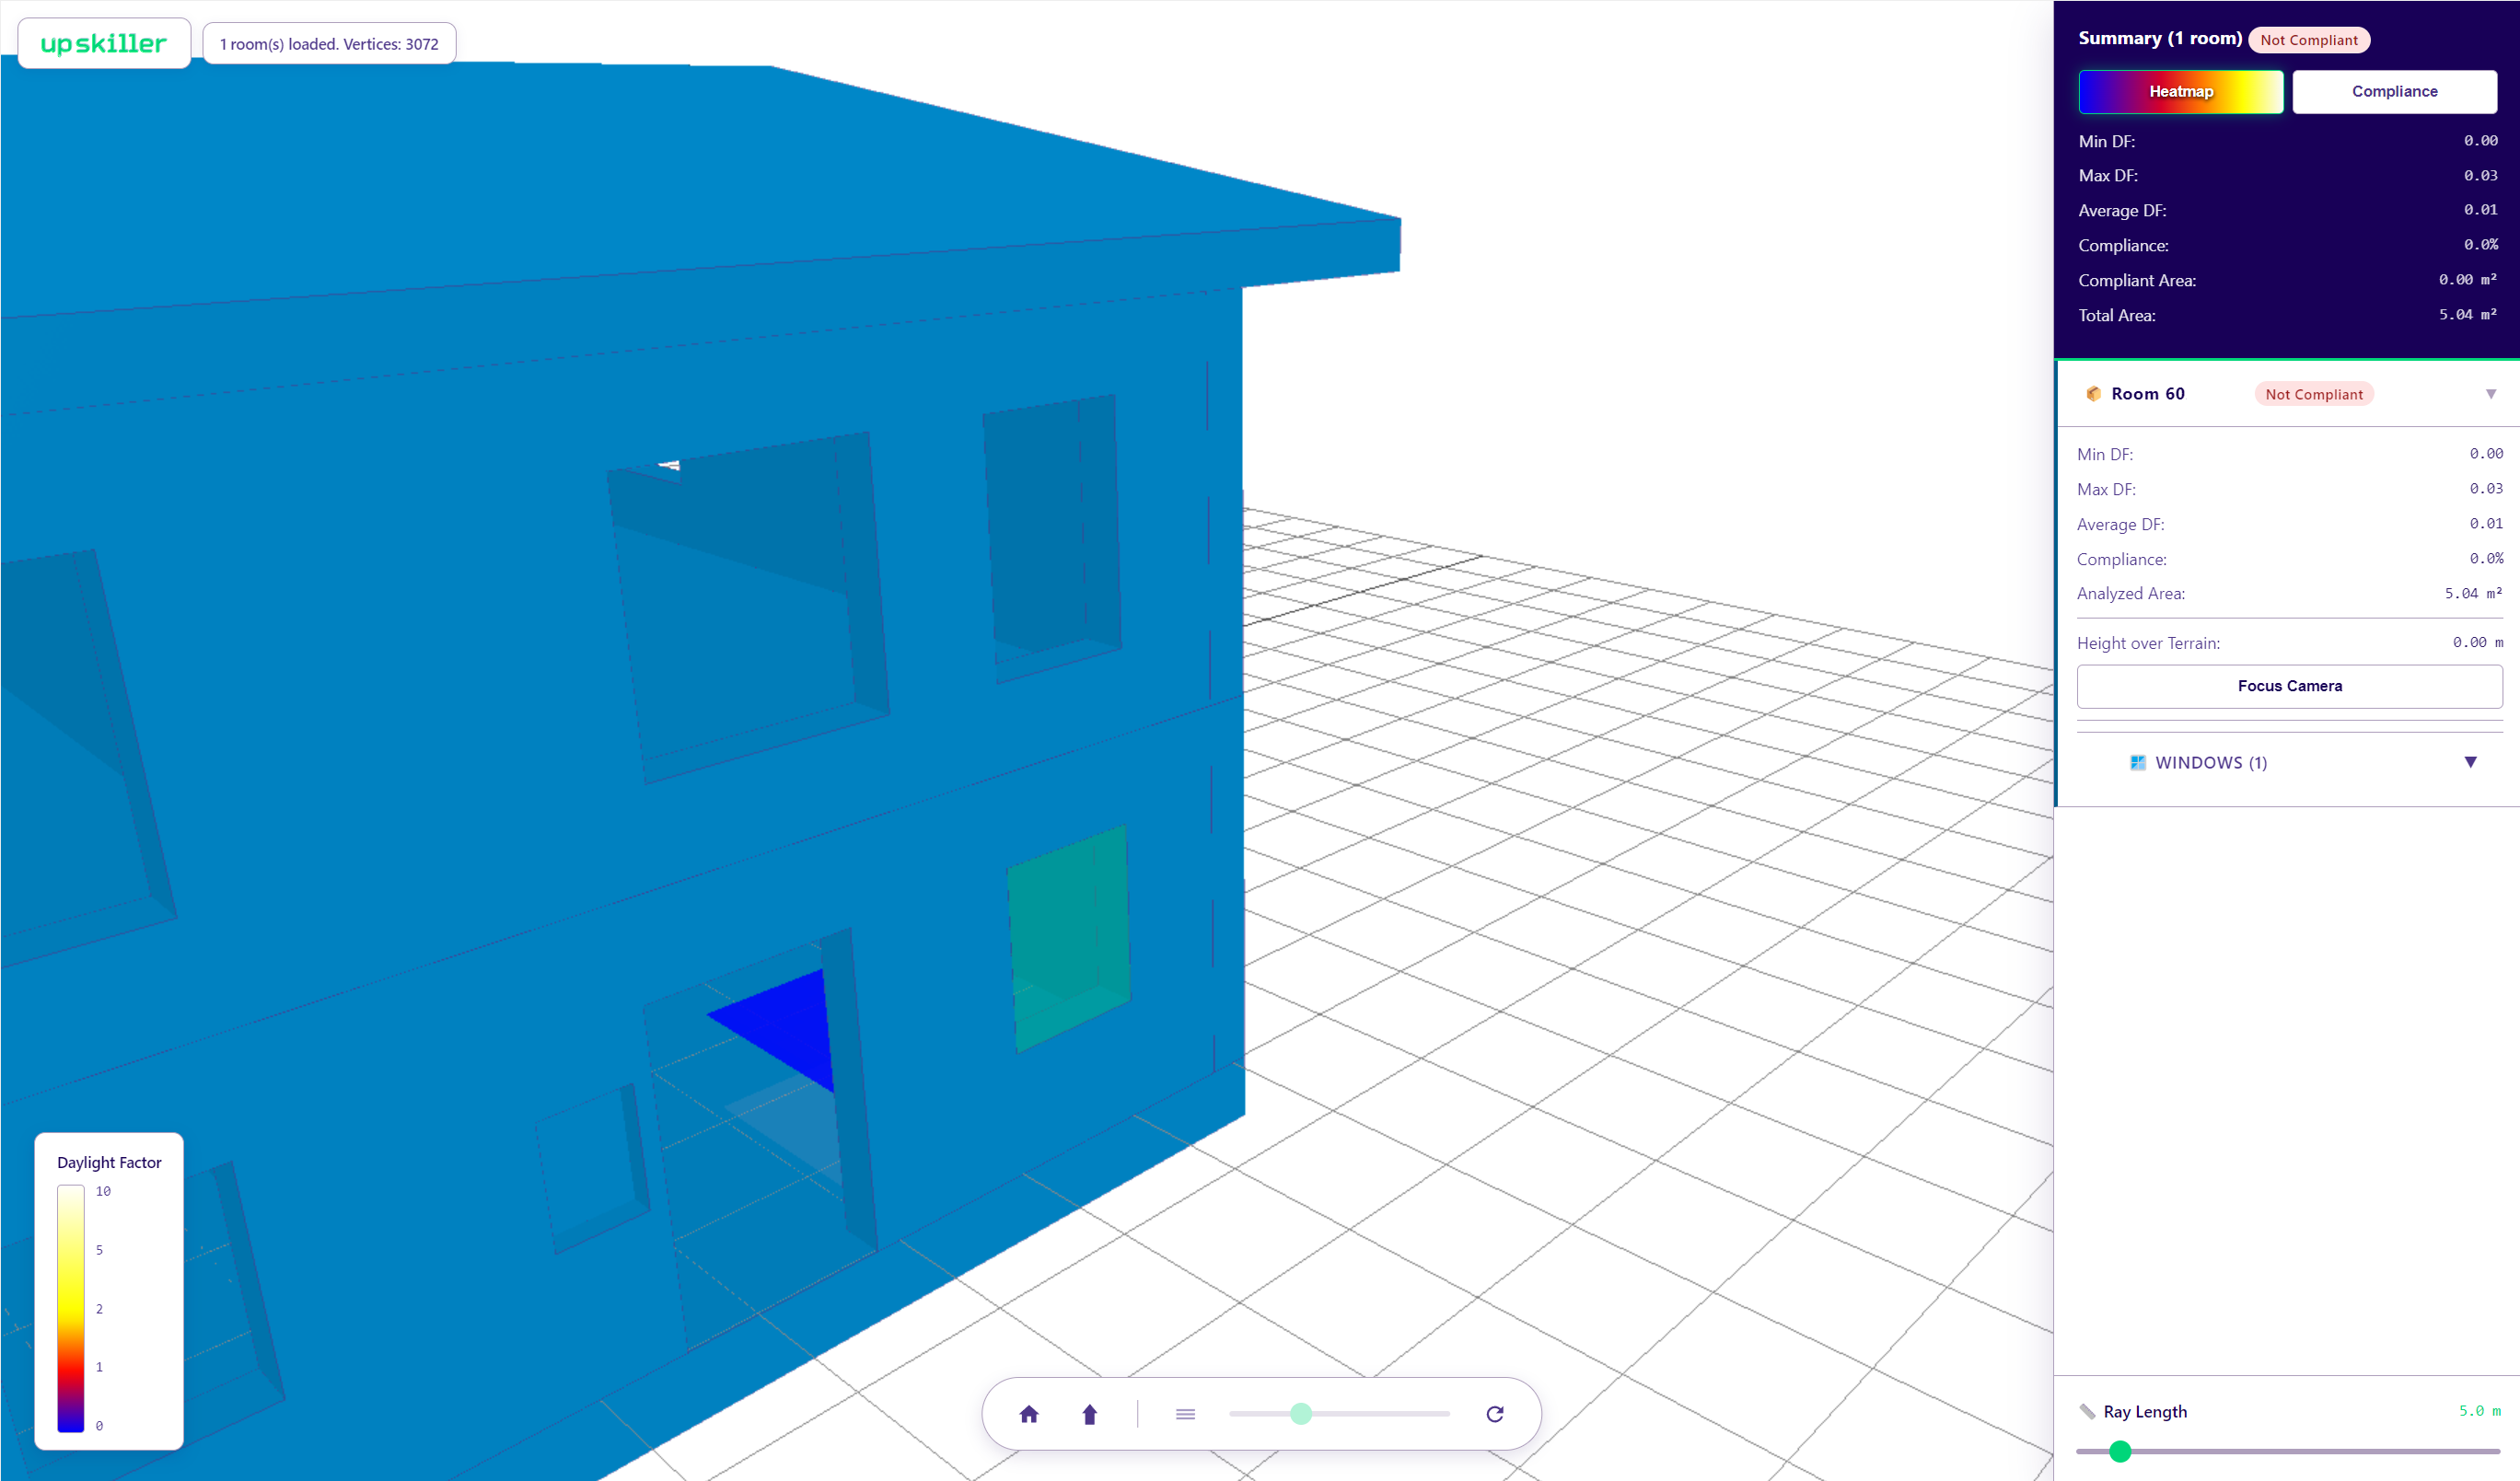
LUX excludes geometry below the room's floor to optimize performance. The visible grid represents the detected Terrain Level.
To speed up the transfer to the server, LUX also skips walls outside an analyzed window's field of view, they are not sent and do not appear in the viewer. This applies only to walls. The wall containing the window itself is occasionally skipped too, this is expected and has no effect on the analysis.
Scene Navigation
Navigation matches Revit's own 3D view controls:
- Rotate: Hold Shift and the middle mouse button, then drag.
- Pan: Hold the middle mouse button and drag.
- Zoom: Scroll wheel.
View Controls
The control bar at the bottom aligns the camera, manages the cutting plane, and switches the projection mode.
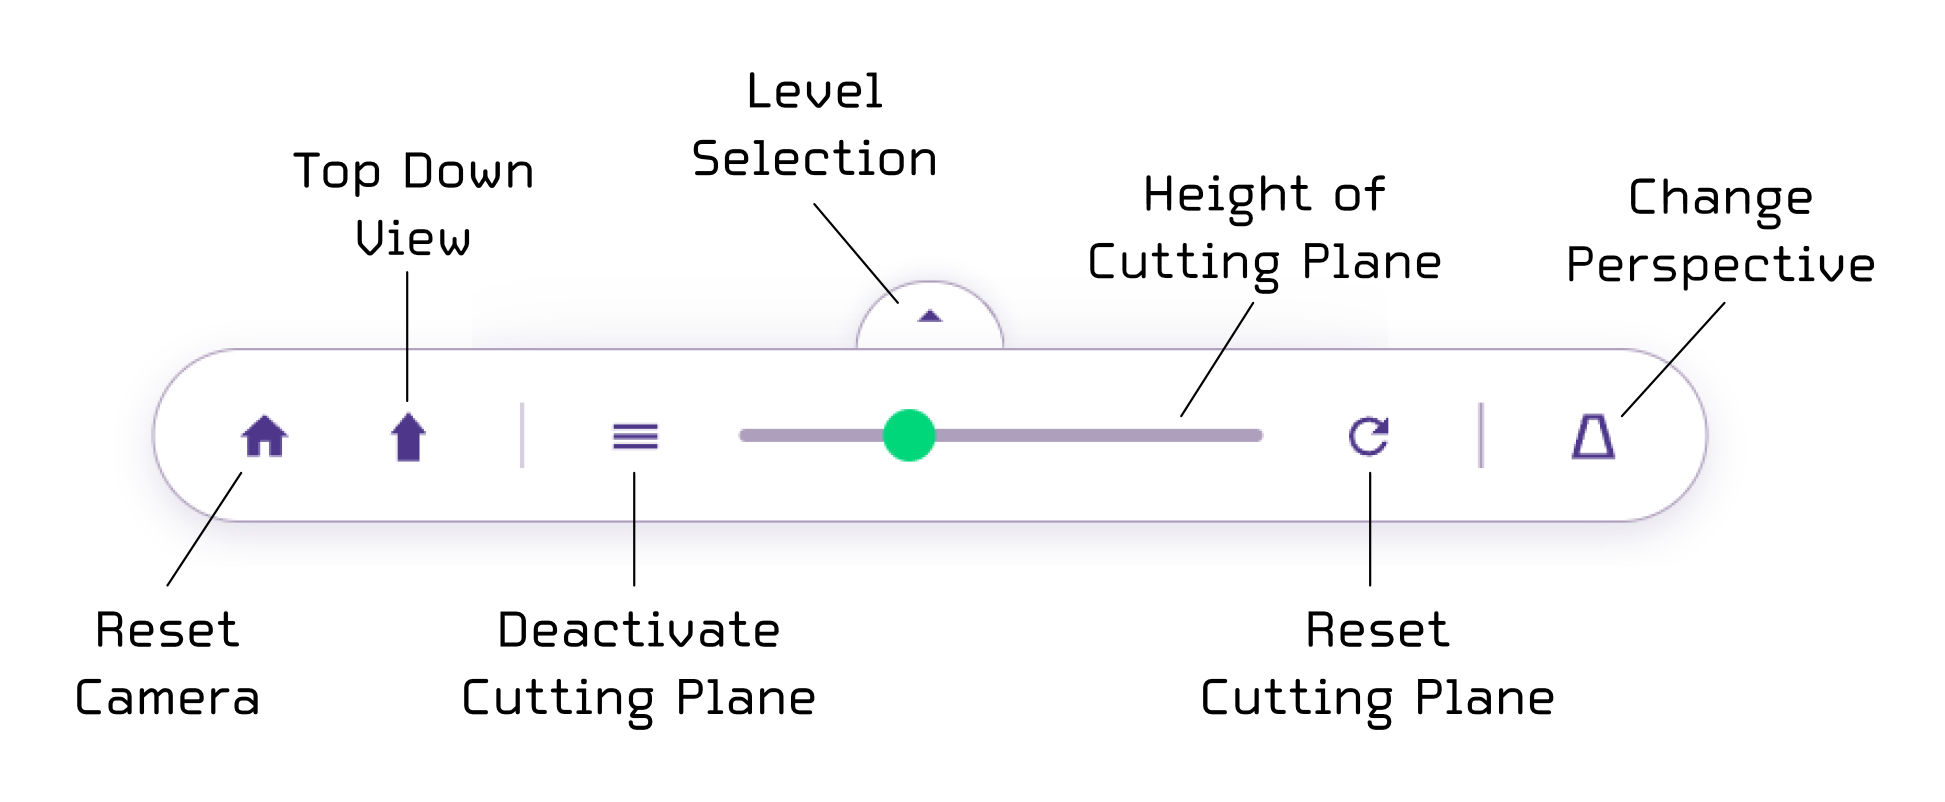
From left to right:
- Reset Camera: Resets the view to a default perspective encompassing the entire model.
- Top Down View: Switches the camera to a top-down plan view.
- Deactivate Cutting Plane: Toggles the visibility of elements above the cutting plane. When active (default), geometry above the cutting plane is shown as a transparent wireframe. When deactivated, the full model is shown solid.
- Height of Cutting Plane: Manually adjusts the vertical height of the cutting plane.
- Reset Cutting Plane: Resets the cutting plane height to the default level (just above the windows).
- Change Perspective: Switches the camera between orthographic (no perspective distortion) and perspective projection, keeping the current view angle.
Level Selection: Click the tab above the control bar to open a list of the project's levels. Selecting one moves the cutting plane to that level's height, the height slider updates to match.
Room, Window & Door Details
The sidebar delivers granular data for every analyzed element, starting with a summary.
Summary
The sidebar opens with a summary of the current selection. Selecting a single room summarizes that room, selecting multiple rooms (for example, a full apartment) aggregates them into one summary. Some standards, like BFS 2024:8, evaluate compliance on this aggregated result rather than per room.
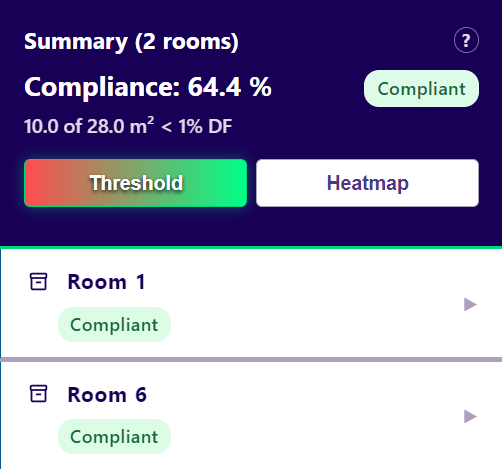
Click Threshold or Heatmap to switch how the floor is colored: Threshold shows a pass/fail gradient against the standard's limit, Heatmap shows the continuous Daylight Factor (DF) distribution.
The heatmap doesn't cover the full Revit room area. Some daylight standards ignore measurement points within a set distance of a wall, up to 50 cm. When such a standard is selected, LUX excludes that margin automatically, this is expected and not a sign of a geometry error.
Room Data
Each room header displays the Room Name and key properties (Area, Height, Cluster).
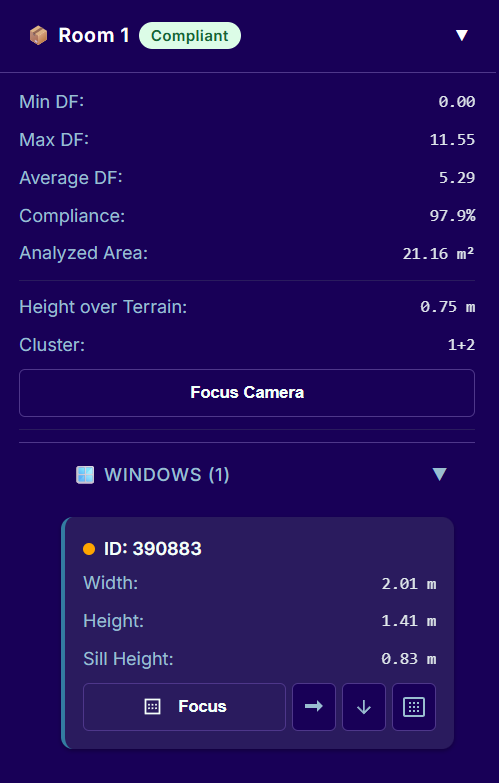
Analysis Statistics & Compliance: The sidebar provides detailed metrics for each room. Compliance is evaluated against the thresholds defined by the standard selected in Analysis Settings, and shown as a pill on the room header and on the summary:
- ● Compliant: Criteria met.
- ● Borderline: Very close to the threshold.
- ● Not Compliant: Insufficient daylight.
LUX's calculation carries a margin of tolerance. Treat a Borderline result with caution: check that room's results carefully, and consider adding a safety margin before relying on it.
Controls:
- Focus Camera: Centers the 3D view on this room.
Window & Door Data
The sidebar lists analyzed windows and doors with their dimensions and a status indicator.
Confidence Score: A colored dot indicates the reliability of the glass detection:
- ● Green (Verified): Explicit glass geometry found.
- ● Orange (Estimated): Glass area derived from heuristics or reference corrections.
- ● Red (Failed): Geometry issue or analysis failure.
Analysis Tools: Toggle specific visual overlays for each window or door:
- Focus: Centers the camera on this window.
- Horizon Angles: Toggles obstruction lines showing where the horizon is blocked.
- Zenith Angles: Toggles lines showing overhead sky visibility.
- Glass Geometry: Toggles a cyan overlay showing the geometry identified as transparent glass.
Obstruction Visualization
Verify if external obstructions (buildings, terrain) are correctly detected by visually tracing the testing rays.
A relevant obstruction blocks a substantial part of the sky as seen from inside the evaluated rooms: neighboring buildings, the project's own balconies and wings, etc. See Obstructions for the full rule.
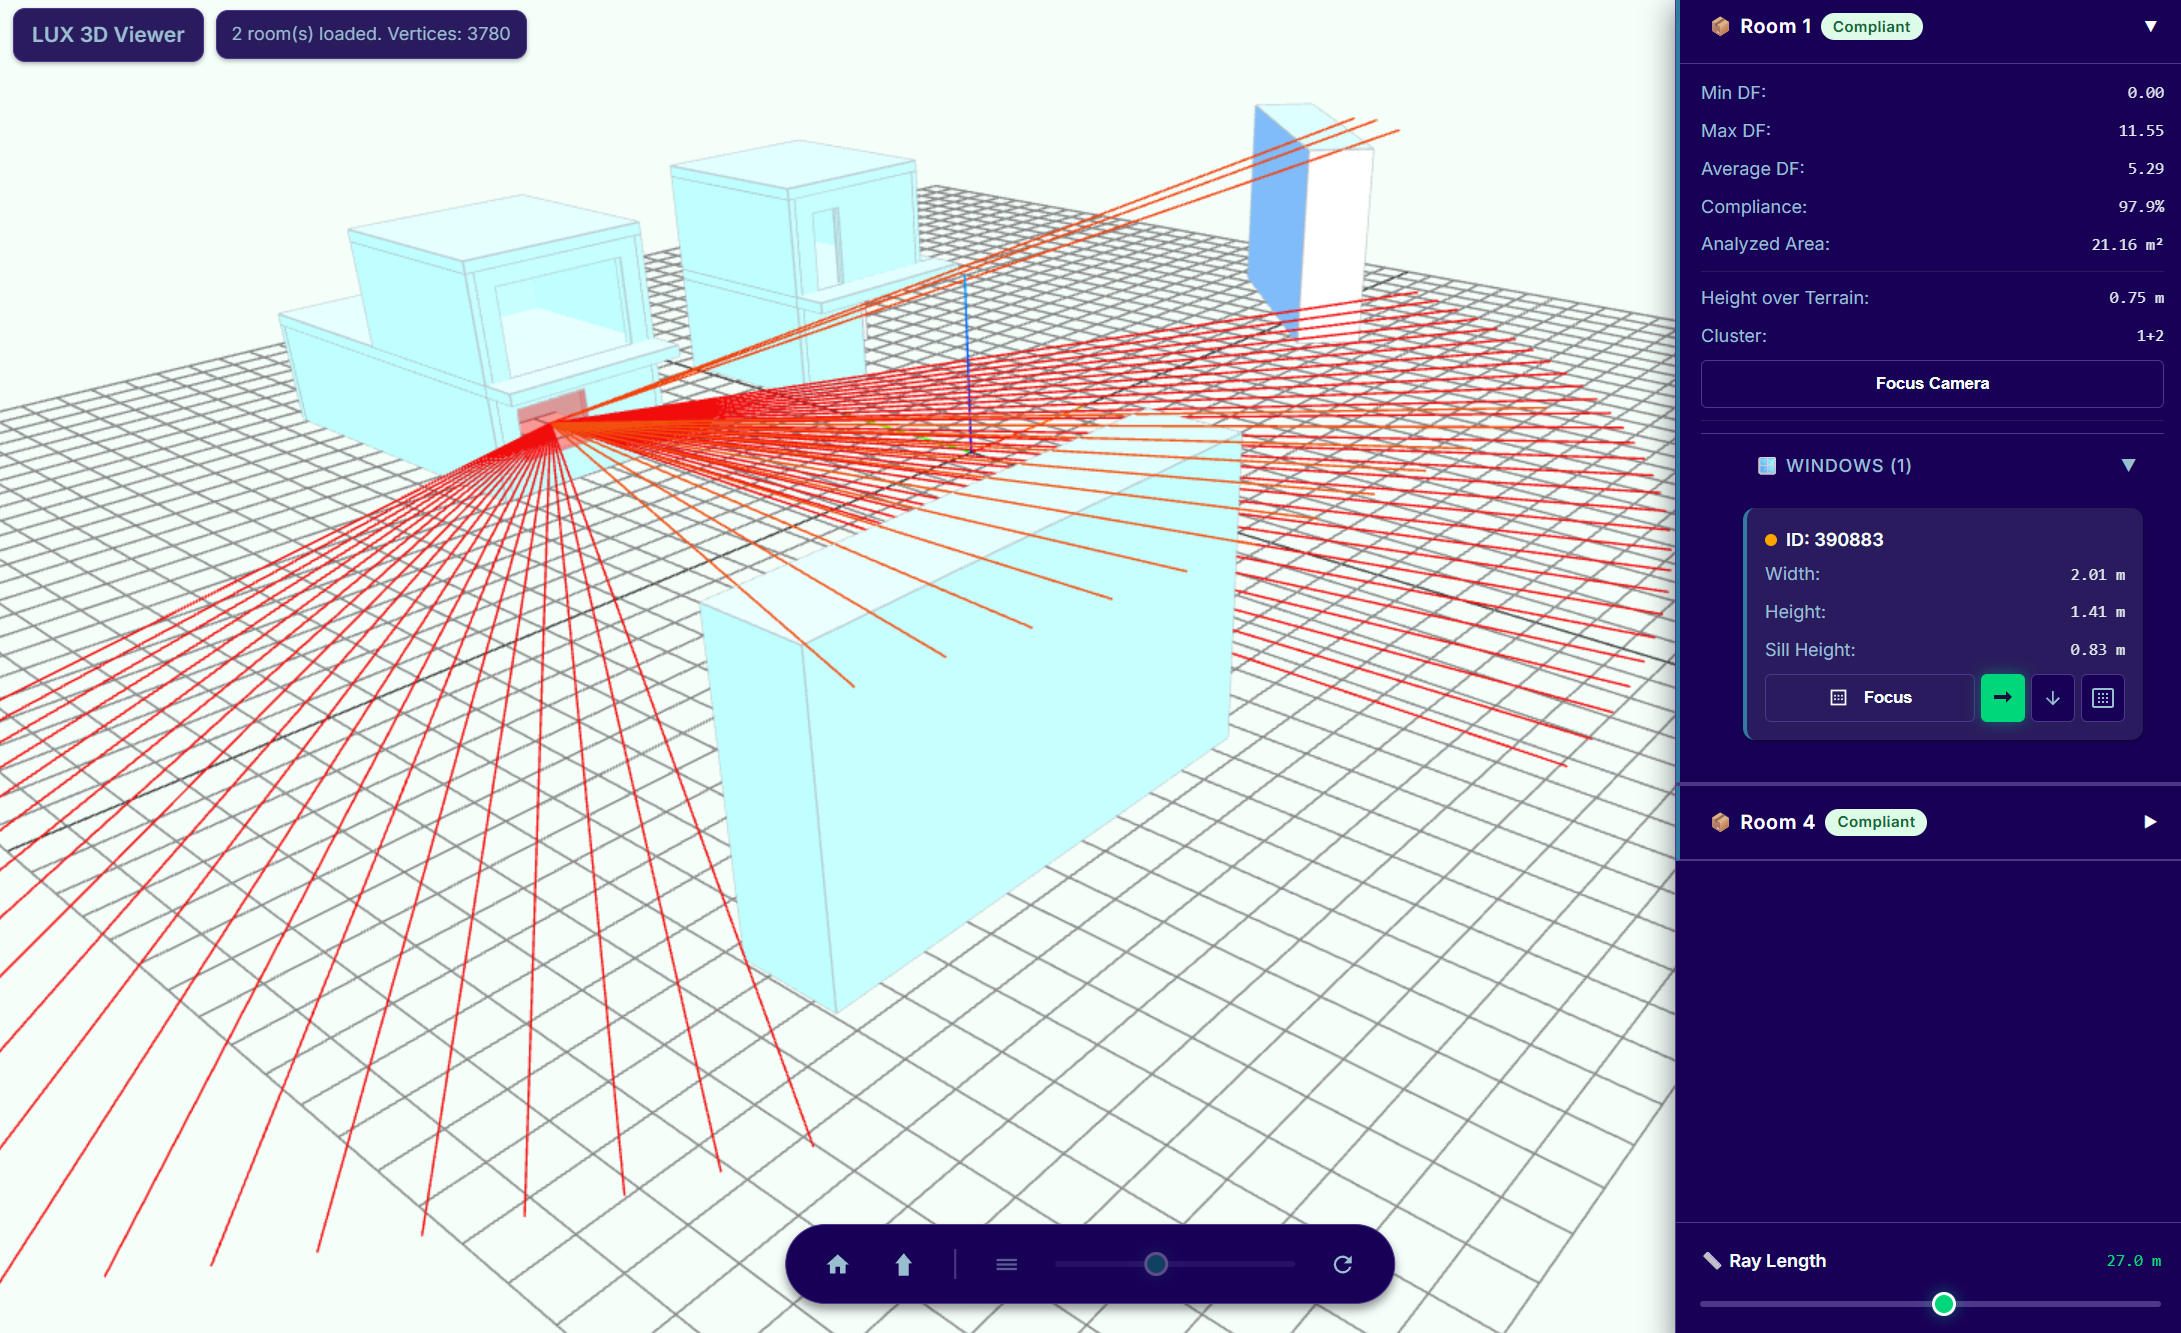
Use the Horizon and Zenith buttons in the window list to show or hide the obstruction rays separately. Use the Slider at the bottom right of the screen to adjust the visual length of the rays and verify intersections with nearby or distant obstructions.
Verification Checklist
Use the 3D Viewer to verify that the extracted geometry provides a correct basis for analysis.
Room Area
Verify that the green floor element accurately represents the room boundary. Check if all directly connected rooms (clusters) are included in the visualization.
Opening Volumes (Reveal Depth)
Inspect the red transparent boxes filling the windows and doors:
- Coverage: The box must fill the entire opening.
- Alignment: The box should align with both the interior room face and the exterior facade edge.
- Depth: The box thickness represents the calculated reveal depth.
Verify this especially for complex wall structures where a structural wall and a separate facade layer (e.g., thermal insulation) are modeled. LUX typically determines the total combined thickness, but manual inspection ensures accuracy.
Horizon and Zenith Angles
Toggle the rays for individual opening elements to verify obstruction and sky visibility calculations. Horizon rays represent ground-level obstructions and building heights, while Zenith rays measure overhead sky visibility. Verify that these rays correctly intersect with surrounding buildings or terrain to ensure accurate shading and obstruction data.
Glass Area and Ratio
Enable the Glass Geometry overlay to inspect the extracted transparent area. Using a per-type verification strategy is efficient: if the extraction is correct for one family instance, other parametrically modified instances of that same type are usually accurate. If the detected area is incorrect, adjust the Revit family material settings to ensure proper glass identification.